Getting Started with SenseDeep

This Getting Started Guide will walk you through the setup process and give a quick peek at some of the features of SenseDeep.
Take the Quick Tour first if you want to see what SenseDeep can do or the DynamoDB Studio Tour for the DynamoDB studio inside SenseDeep.
Or read the Data-Sheet If you want to see all the features in one place.
If you prefer a video instead, watch Setting Up SenseDeep Video.
Registering

To start with SenseDeep, navigate to https://app.sensedeep.com and click register to create a new account.
You can register using a social media account for: Amazon, Facebook or Google. You can also register using a username and password of your choosing.
During registration, you may receive a confirmation code via email. Enter that when prompted.
After logging in, SenseDeep will start an “Add Cloud” wizard to connect to your AWS account.
Connecting Your AWS Account
SenseDeep can connect one or more AWS accounts from multiple regions where each Account/Region is represented by a SenseDeep cloud. These are then aggregated and presented as a unified desktop.
SenseDeep connects to AWS accounts via an IAM role to grant controlled access to your account. The IAM role is created via a CloudFormation template that authorizes access and the necessary resources to enable SenseDeep in your account.
Configuring an AWS Account

From the home page, the Add Cloud wizard will be displayed. There, specify a name for your cloud (AWS account) and select your desired AWS region.
You can choose one of two connection methods. The first method runs a CloudFormation template via the AWS console. The second uses existing AWS keys to run the template in the background.
If you select the CloudFormation option, you will be prompted to approve a CloudFormation template via the AWS console. When you click Save from this page, you will be prompted to confirm the action before being redirected to the AWS console in a new browser tab. After logging in, you need to confirm the Cloud Formation template parameters. When the template completes, return to the SenseDeep page to begin using the service. This will create an IAM role for use by SenseDeep on behalf of your account.
If you select the AWS Keys option, enter a set of AWS keys that have admin authority. These keys will temporarily be used to run the CloudFormation template in the background that will create the IAM role to grant SenseDeep controlled access to your account.
Selecting the Resources to Monitor
Select the logs you wish to monitor. If you have a very large number of resources in an AWS account, you may get higher performance by selecting a subset of logs to monitor. You can select the logs by regular expression or matching tags.
Auto Discovery
Once your cloud is connected, SenseDeep will quickly discover your AWS resources including logs, lambda functions, DynamoDB tables, EventBridge buses and other AWS resources.
SenseDeep subscribes to ingest new log data from the logs you selected when you created the cloud connection. Any log data that your apps created after connecting the cloud will be available for viewing. If you require historical log data, you can edit the log from the log list and select Backfill Log to read historical log data.
DynamoDB Studio
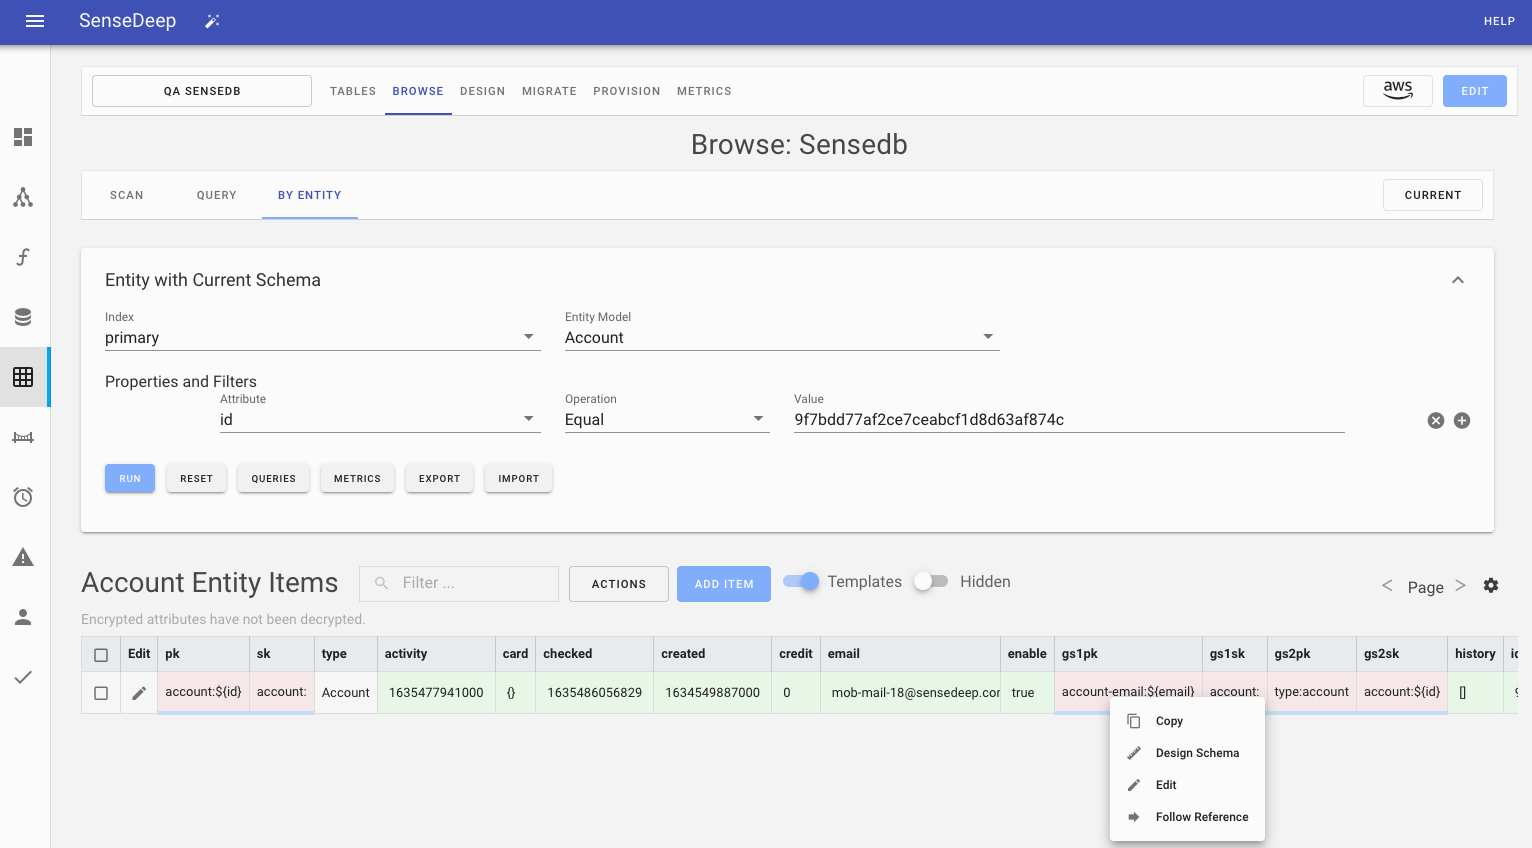
SenseDeep has a complete DynamoDB developer studio to support your DynamoDB designs and single-table development.

The DynamoDB studio includes a table manager, data item browser, single-table designer, provisioning planner, database migration manager and in-depth table metrics.
SenseDeep DynamoDB studio is a comprehensive set of DynamoDB tools that are single-table “aware”. This means SenseDeep can understand your single-table designs and application entity data and can guide your design, queries and monitoring based on this deeper understanding.
Lambda Functions
SenseDeep creates a unified list of your lambda functions for all connected clouds and regions. You can navigate to the list of functions to see the list of your lambda functions.

Function list includes the number of invocations (events), average function duration, the number of errors, cold starts, memory used and the estimated monthly cost of the function. These metrics are for select time period.
You can sort by columns to see the most recently invoked functions, the most expensive functions or the functions with the most errors.
You can change the metric timescale via the timescale button to the right of the function search box. Select last hour, day, week or custom date range.
Lambda Detail
Selecting a lambda function from the function list will display detailed graphs and metrics for the function. For your Lambda functions, SenseDeep provides a dynamic list of your Lambdas.

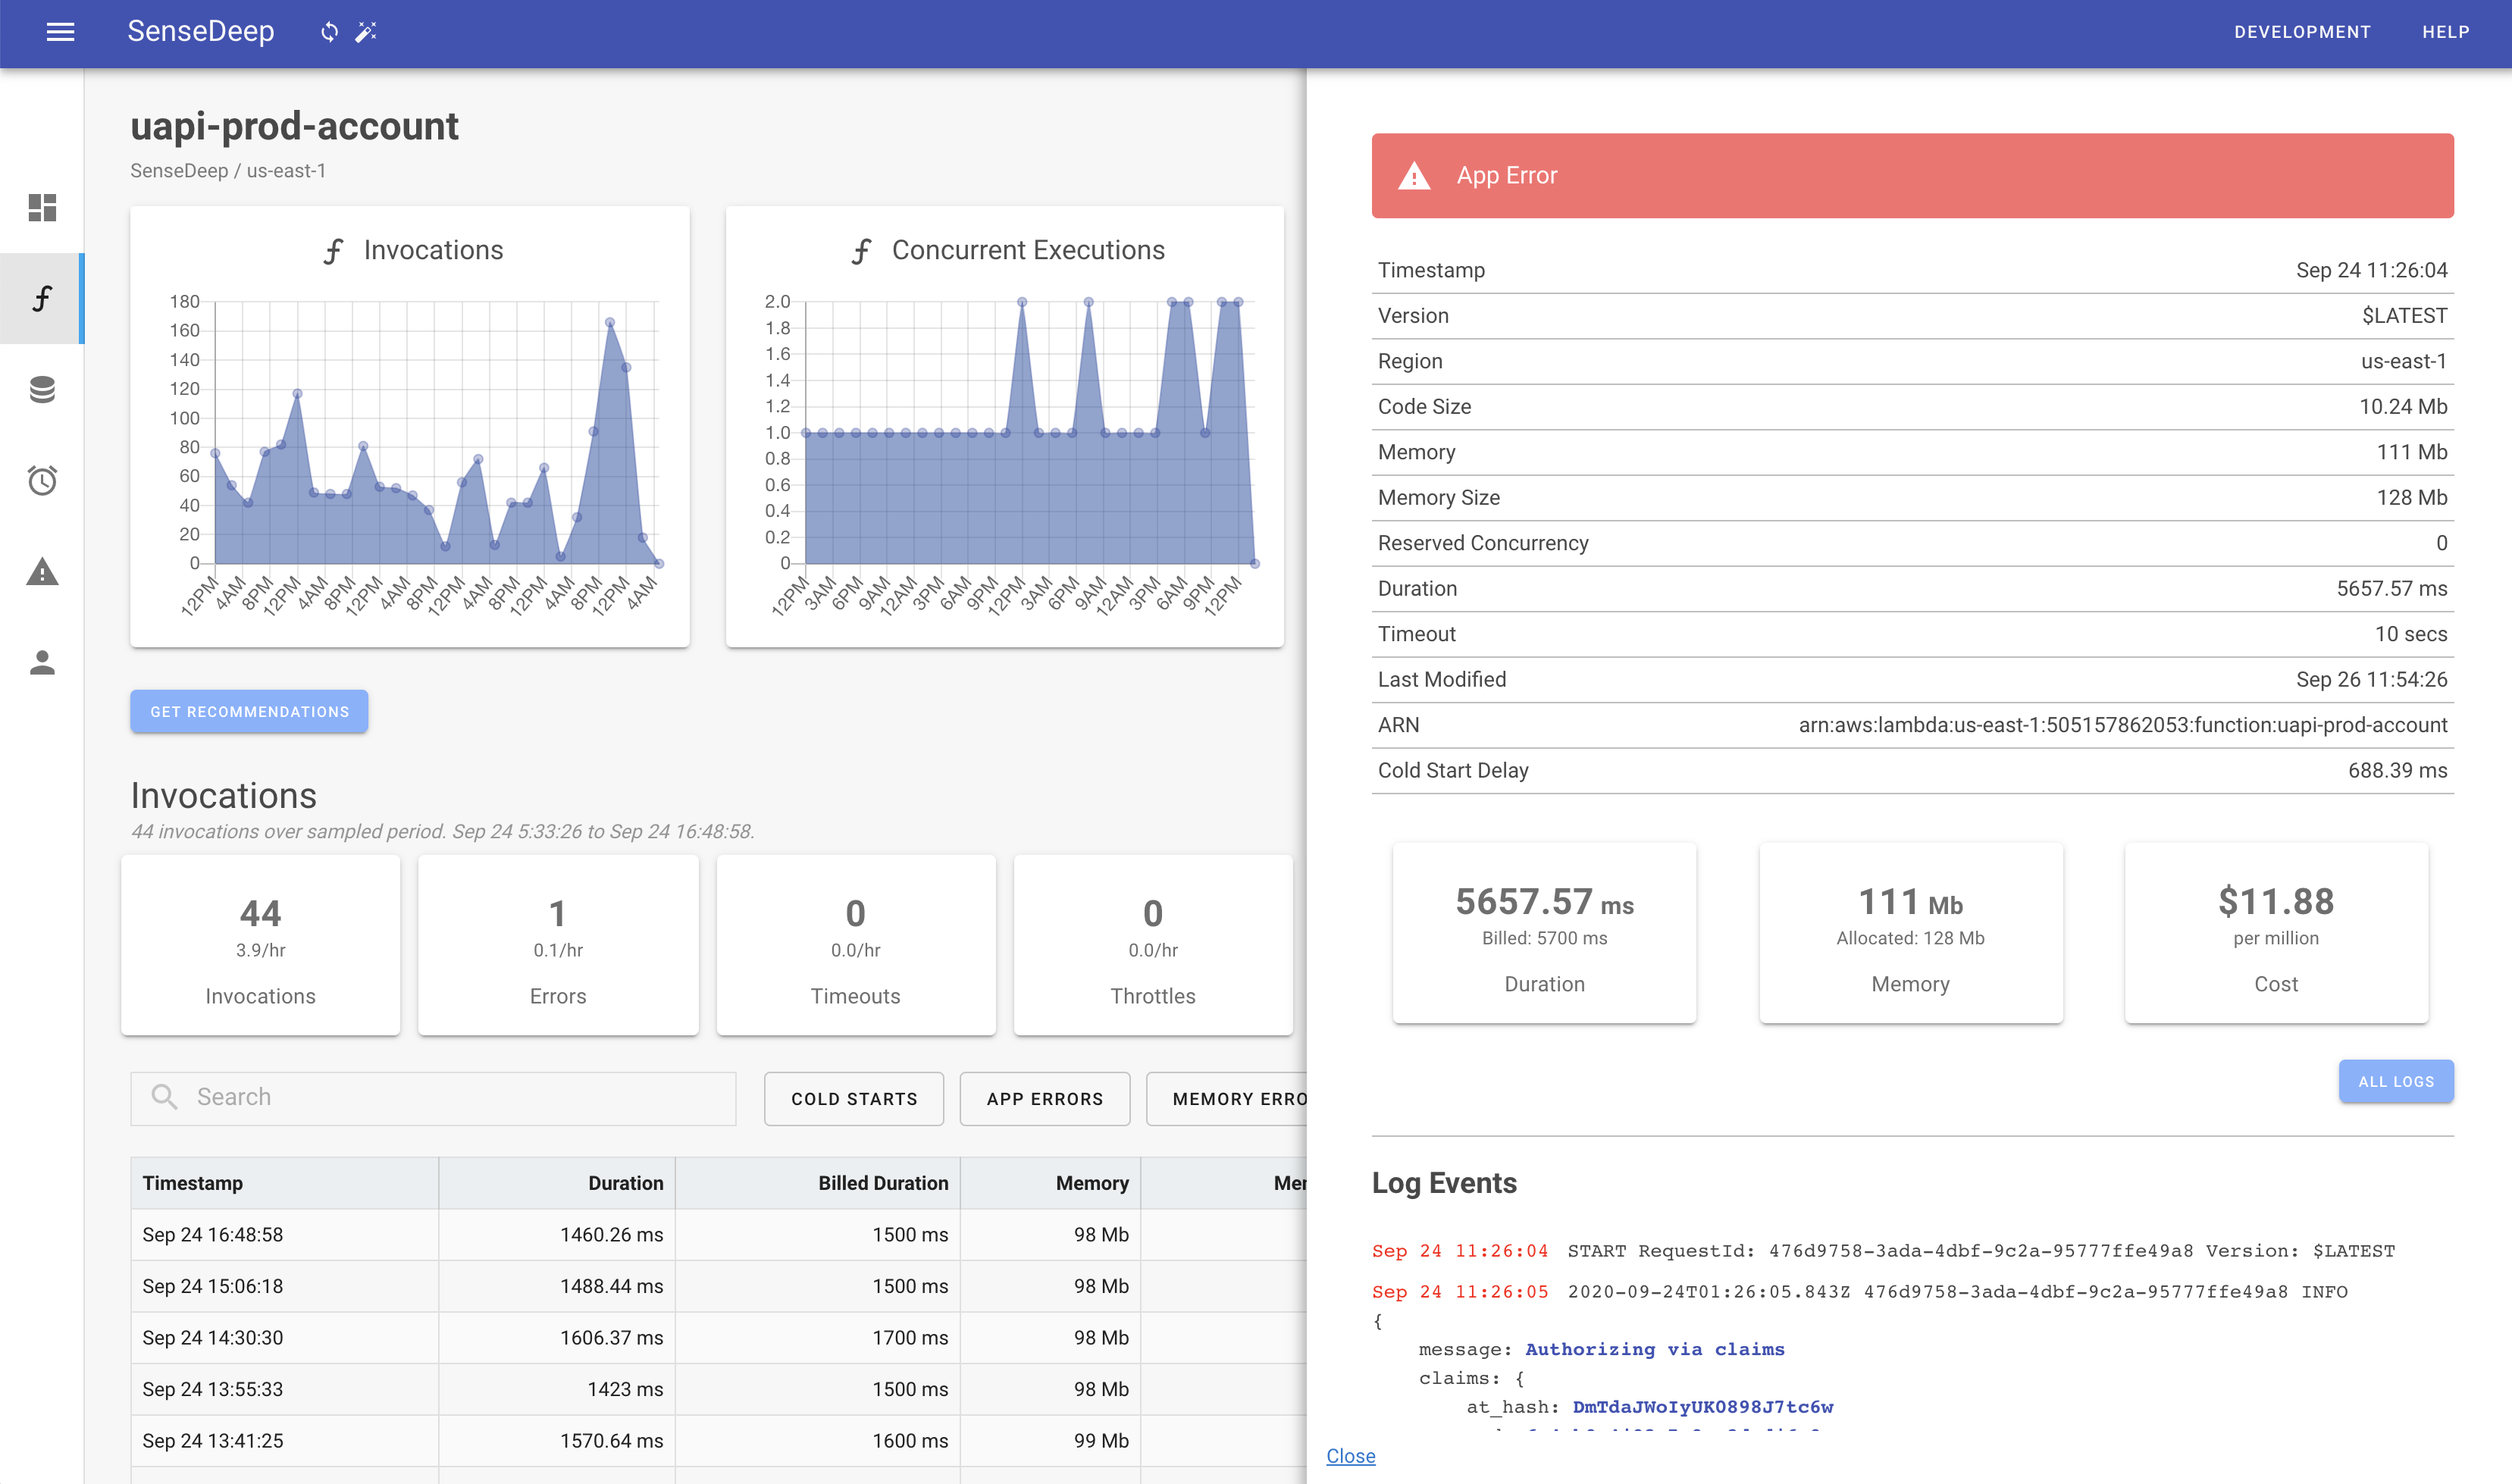
The graphs shows function performance including the number of invocations, concurrent executions, errors and the average duration. You can select the graphed period to be per hour, day, week, month or custom period using the period button at the top right. Next to that is the interval period which defines the metric sample size. You can set this to be 5 minutes, one hour or one day.
Below the graphs are key performance indicators for the most recent period. These statistics include the number of cold starts and the estimated cost for the function per month.
Invocation Traces
Below the numeric widgets is a searchable list of function traces ordered to put the most recent invocations at the top. Click on any trace to display the full invocation and details.
Full Invocation Details

The function invocation details make it quick and easy and troubleshoot errors. You can see the complete invocation context including function configuration and the relevant log entries for the invocation.
The function version, timeout, code size and ARN are presented at the top.
Below that, the exact invocation log entries are displayed. JSON log entries are formated, color coded and expanded for clarity. You can click on the All Logs button to immediately jump to the full lambda log at the exact location of the invocation. From there, you can see previous and subsequent events in context.
Log List

The Log list displays all your CloudWatch log groups. From the list, you select a log to launch the log viewer.
The list displays the log lifespan which is maximum age of log events that SenseDeep will store in its log database.
Note: If you require log data from before you connected your SenseDeep cloud, edit the log from the log list and select Backfill Log to read historical log data.
Log Viewer
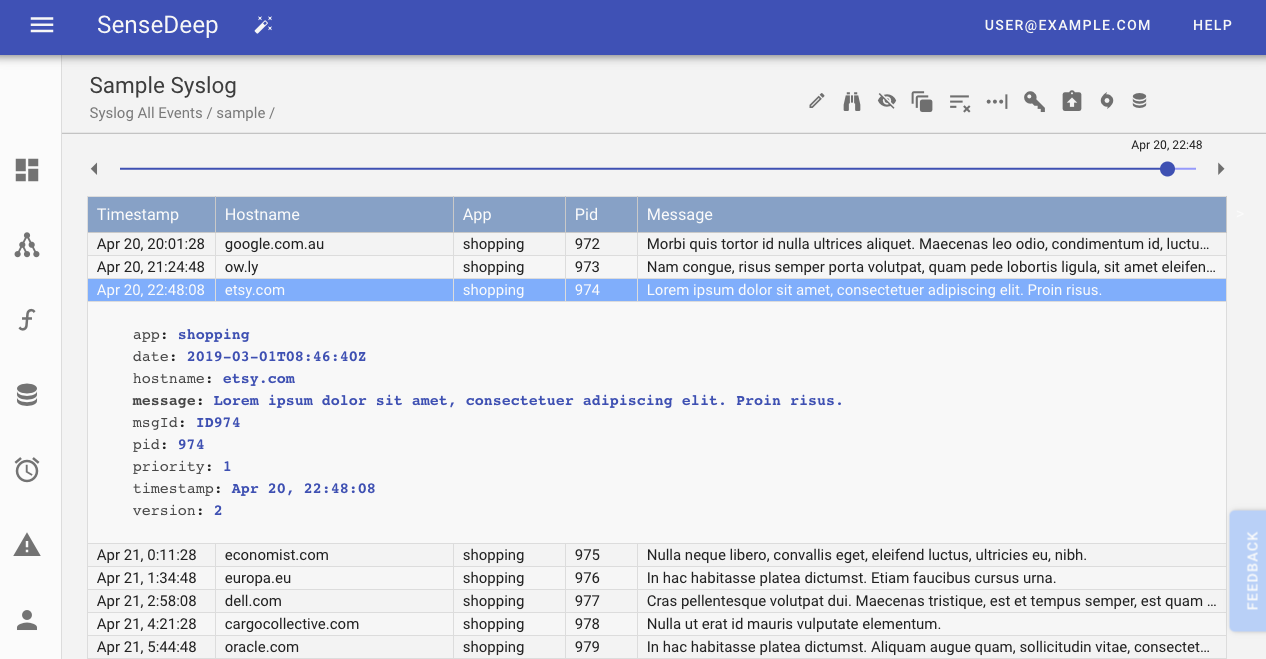
The SenseDeep Log Viewer is a powerful window into your serverless log events. You can search, query and scroll forwards and backwards over log data and SenseDeep will transparently fetch and display log data as required.
The Viewer can display any log events within the defined log lifespan. You can search for any text in log events and can define multiple views of log data that apply custom filters to include or exclude text patterns.
The first and last log events are highlighted with a reverse grey background and the current event is highlighted in blue.

SenseDeep will intelligently parse event fields and map them onto viewer column headings.
You can display log events as a single line, or expand one or more events in a multi-line format for easier viewing.
Viewer Navigation Bar
The SenseDeep Viewer has a navigation bar with the most common commands at your finger tips.
These include:
- hiding lambda service events such as ‘start’, ‘end’ and ‘report’ log events.
- displaying a
livetailing of new events as soon as they are created. - expanding JSON log records in a multi-line display format.

There is much more to SenseDeep including
- A complete DynamoDB developer studio with data browser, single-table designer, migration manager and provisioning planner.
- Alarms that will protect your services 24x7.
- Alarms based on application log data or EventBridge events.
- Notifications to email, SMS, and other channels.
- Metrics and Dashboards.
and we encourage to read the detailed online help via the Help button in the navigation pane.
Enjoy using SenseDeep!
Try SenseDeep
Start your free 14 day trial of the SenseDeep Developer Studio.


Messages are moderated.
Your message will be posted shortly.
Your message could not be processed at this time.
Error: {{error}}
Please retry later.
{{comment.name || 'Anon'}} said ...
{{comment.message}}